
IMPOWER INDEX
If you’re a member of a council’s leadership team, click here to request your own INDEX report.
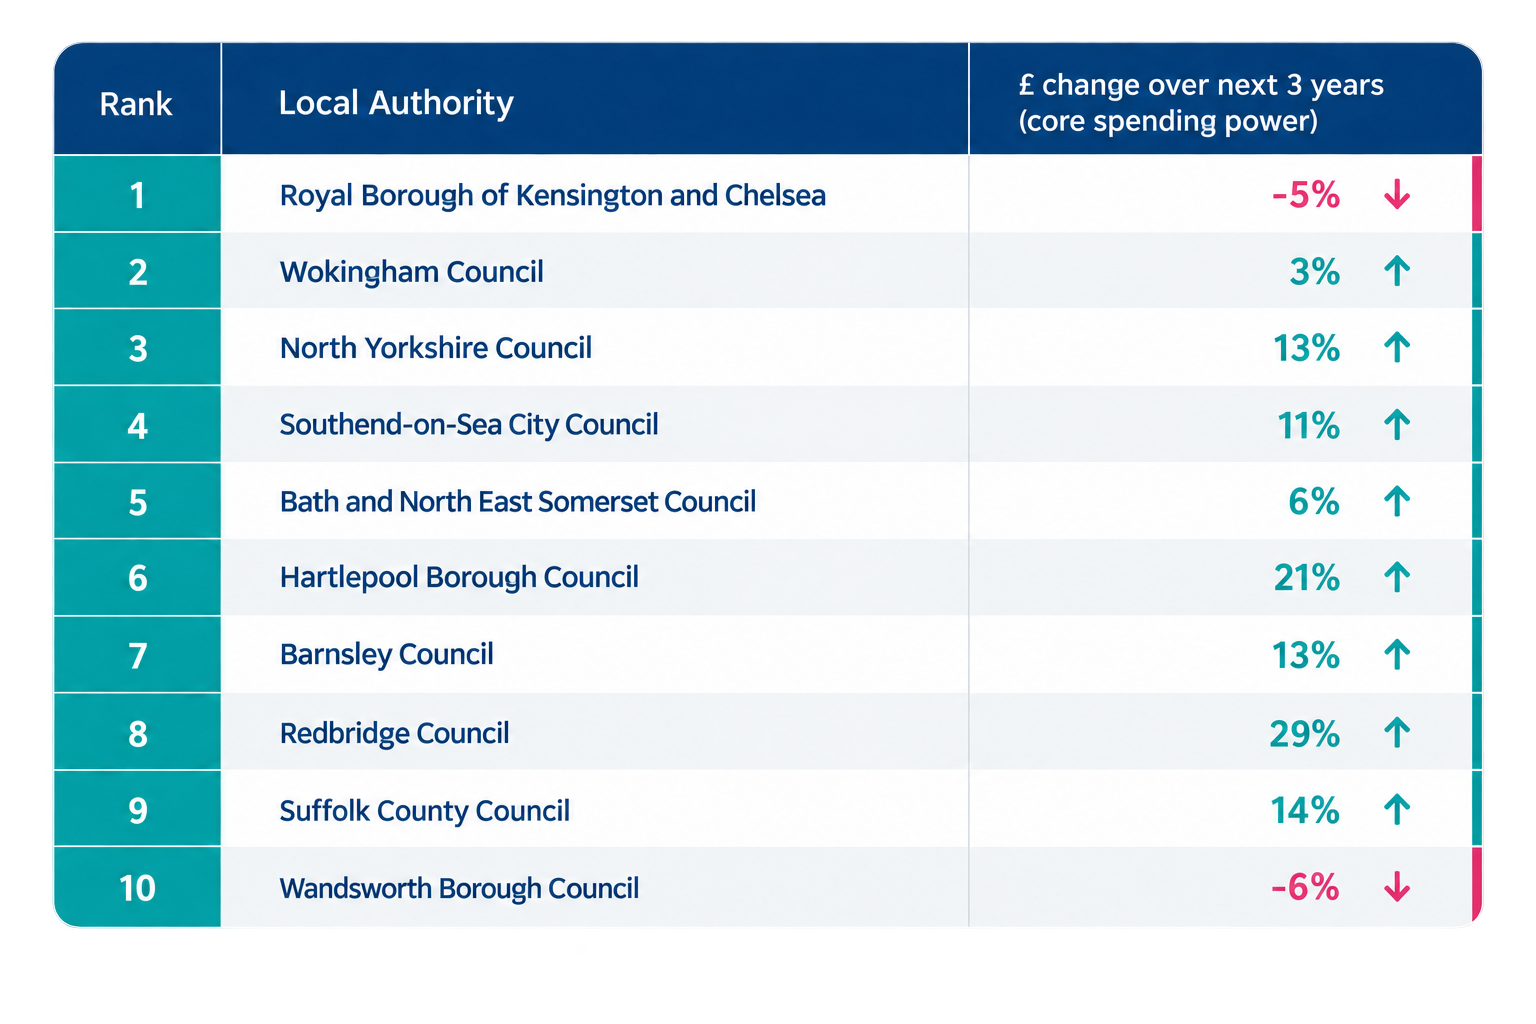
IMPOWER publishes the latest ‘Most Productive Councils’ Top 10 with The MJ
The IMPOWER INDEX is a benchmarking tool with a difference – it grades councils on productivity (outcome value per £). Using publicly available data sets and looking at performance through eight different lenses, it allows councils to compare performance against other authorities (statistical neighbours, regional neighbours, or any others of interest), and drill down into their own data.
IMPOWER INDEX in numbers
councils
specialist modules
datasets feed into the INDEX
The IMPOWER INDEX
We have taken more than 30 councils’ top teams through the INDEX data live in Power BI. Councils have used it to get a shared understanding of productivity across the organisation and set bold medium term ambition for change.
The results and accompanying insights were developed by IMPOWER’s Applied Analytics Practice, a team of highly experienced analysts who lead on delivering scalable and continuous insights across all services areas of local government.
Top 10 productive councils
We publish an annual top 10 productive councils list with the MJ to:
- Promote the importance of looking at outcomes achieved for money spent.
- Celebrate good management grip and decision-making.
- Inspire action.
The latest was published with the MJ on 5th February 2026.
Assessing councils’ future challenges. What is the impact of the three year fair funding settlement?
We have combined productivity data with the funding settlement for each council. For the first time this year, following the Fair Funding Review 2.0 government response, there are big winners, small winners, small losers and big losers. By examining the combination of productivity performance and the impact of fair funding we find councils are falling into specific segments, some with great opportunities to grasp and others with heighted challenges to face up to.
Using the INDEX
The INDEX helps councils to answer a number of strategic questions including:
- How do both outcomes and productivity compare to other councils across England of a similar size, or geographically close by, or statistically similar or even a bespoke selection of councils?
- Are investments in public services working?
- What are the priorities for further improvement?
- Which councils are leading the way and what can we learn from them?
- How well aligned are individual services with council priorities?
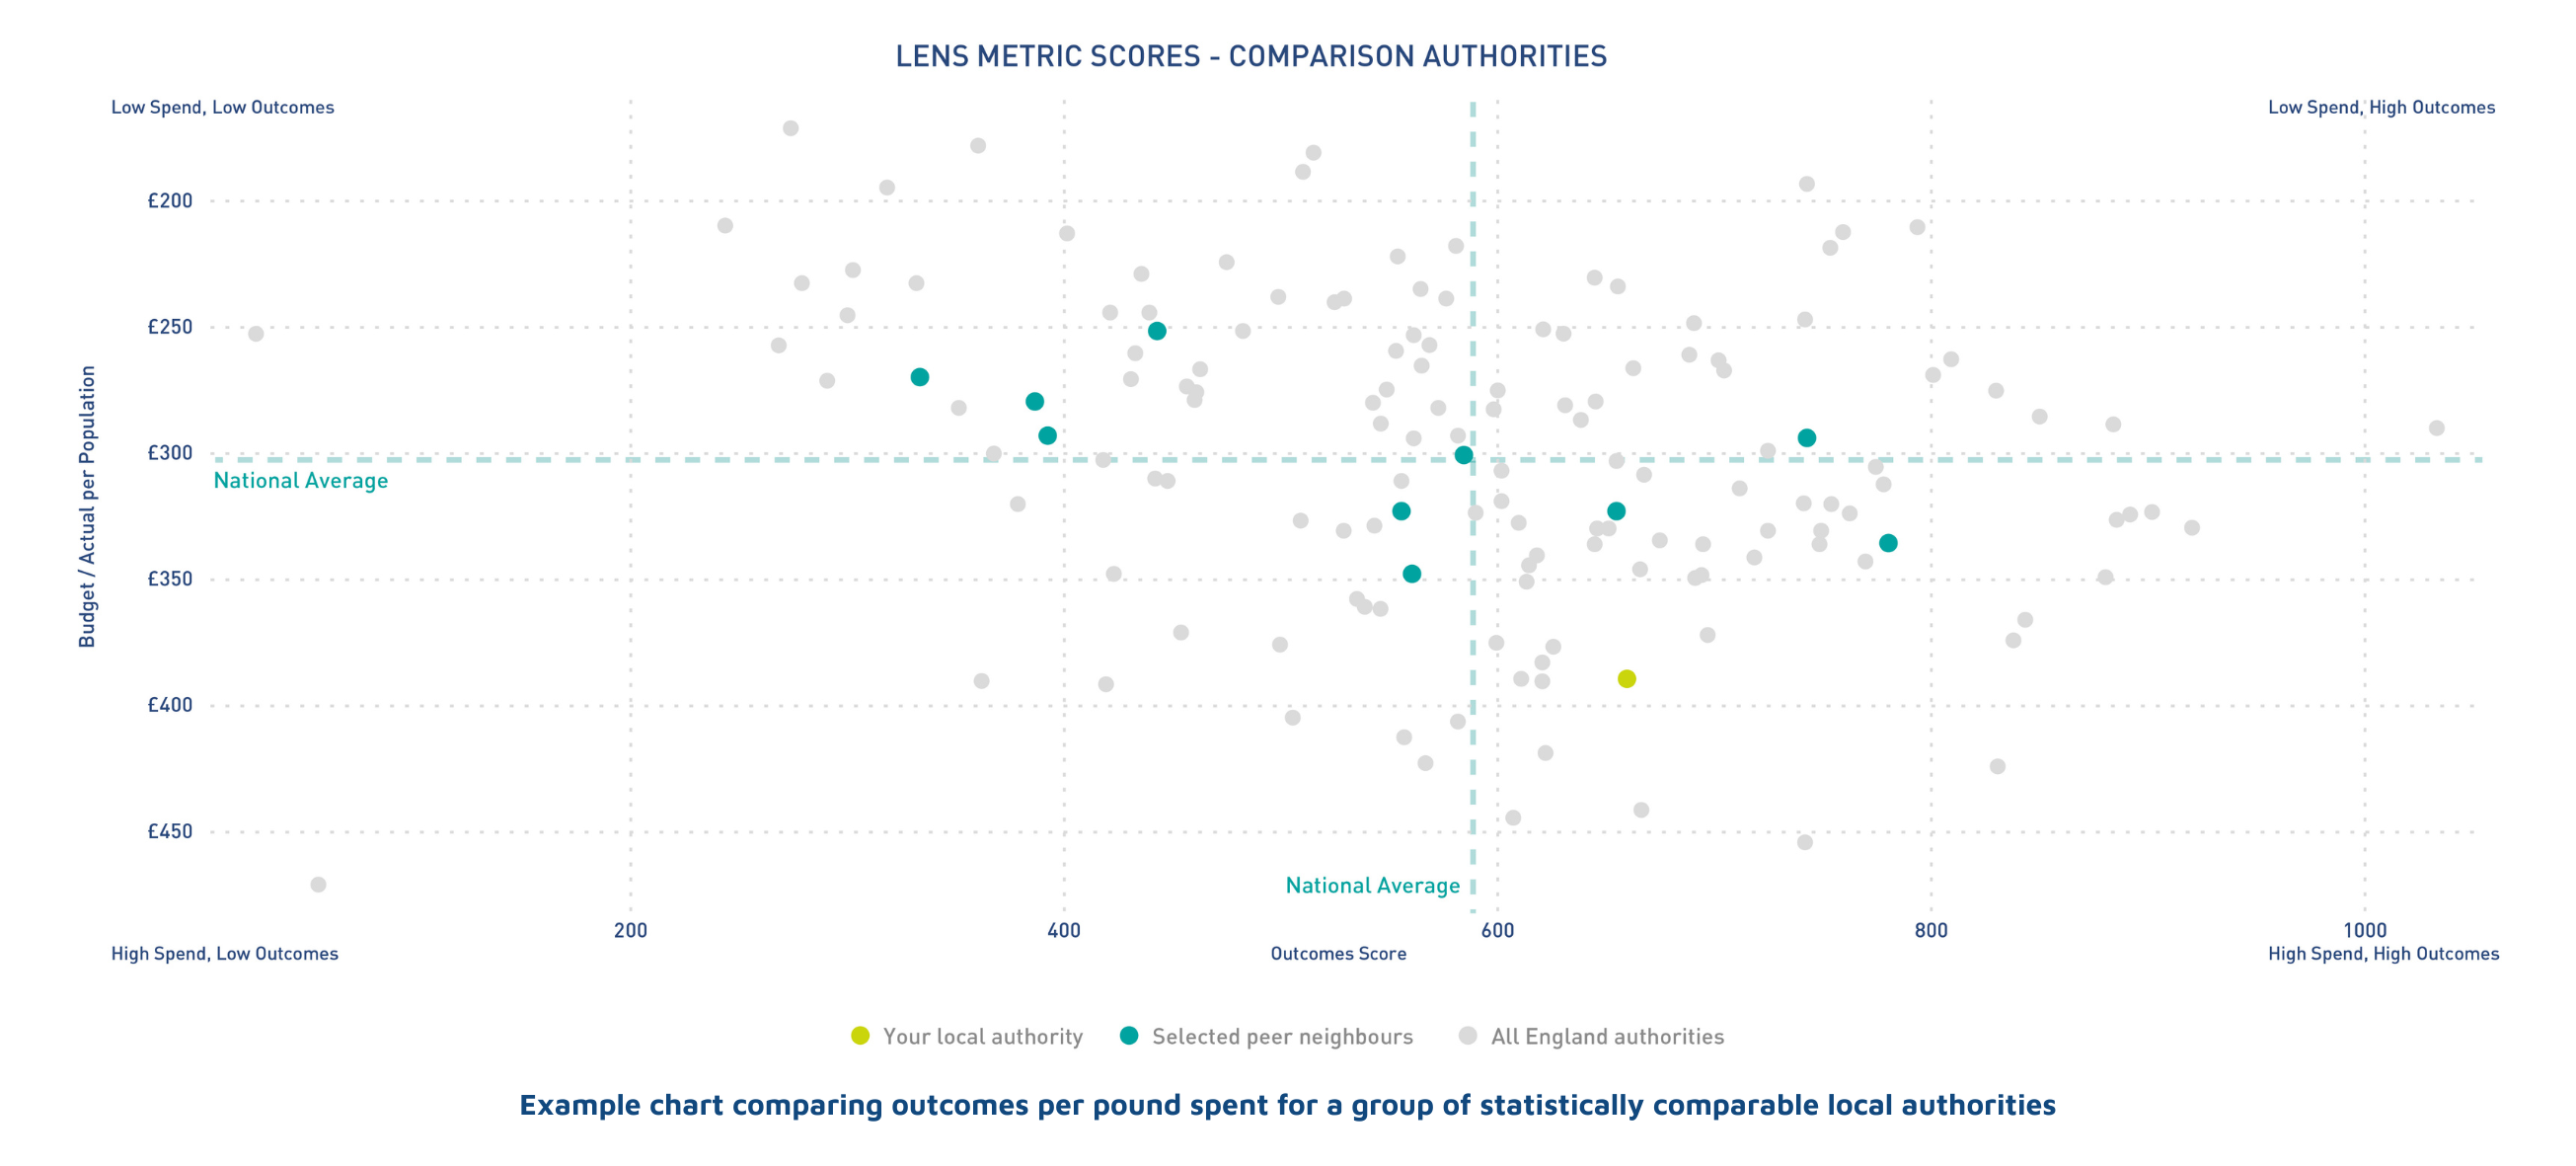
The IMPOWER INDEX enables local authorities and Integrated Care Systems (ICSs) across England to compare their performance against all other local authorities and (for our health-focused INDEX) ICSs.
Uniquely, the IMPOWER Index measures value and productivity by aligning outcomes alongside expenditure. That means we can answer:
- Which councils are spending their money most effectively and getting the best outcomes for residents?
- Which councils and ICSs are leading the way in achieving the best social care and health outcomes, especially those for older people?
- How effective is each council at managing to support the Special Educational Needs an Disabilities (SEND) and care needs of children and young people?
Alongside the overall INDEX, we have also developed eight specialist modules which take an in-depth look into specific areas of public services.
The example below is insight from comparing outcomes per pound spent for a group of statistically similar local authorities.
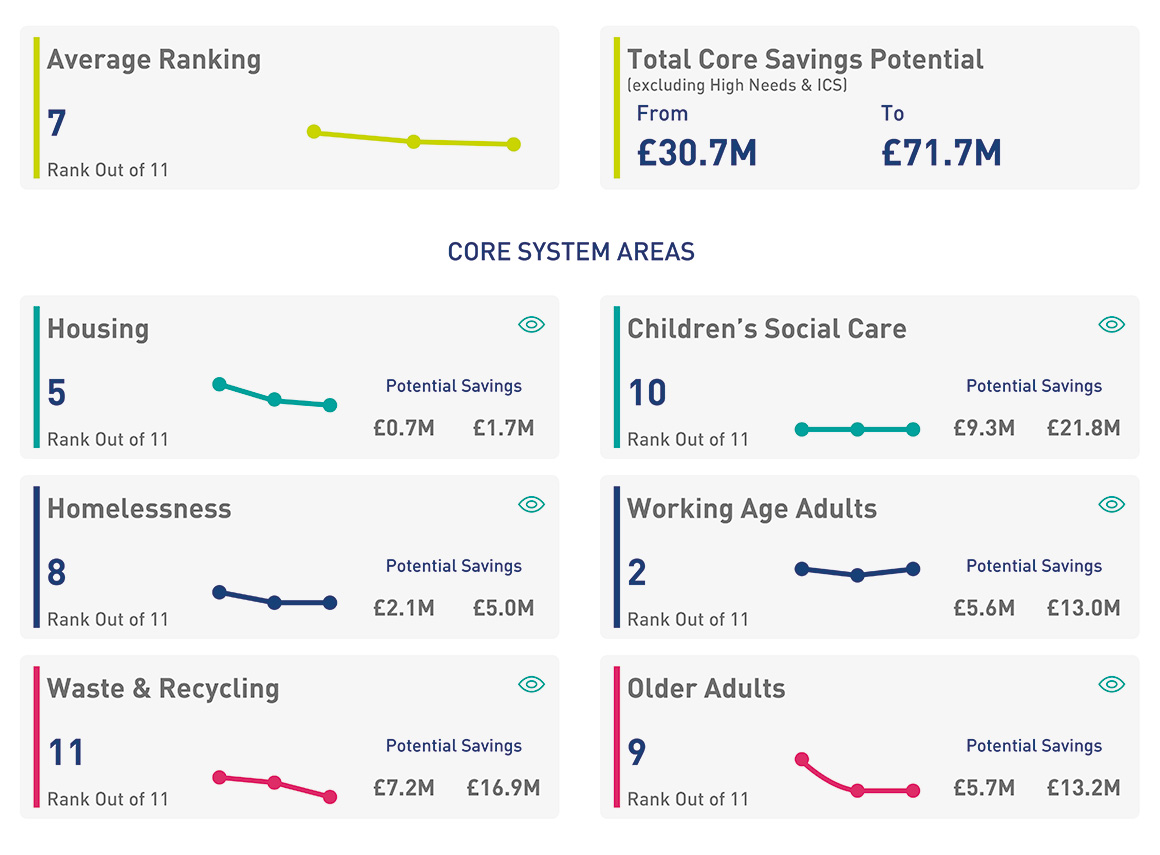
Ranking calculations are based on a basket of metrics curated by IMPOWER to represent whole system performance. Saving calculations are broad estimates only based on closing the gap to the best performing authorities in a relevant peer group.
Top Level INDEX
Ranks council productivity and examines performance through eight lenses.


Adult Social Care Module
Assesses and benchmarks performance across a range of factors, with a specific focus on managing demand.

Children’s Social Care Module
Evaluates outcomes and life chances for children and young people and the financial sustainability of local authority services.

NEW High Needs and Inclusion Module
Analyses and benchmarks performance across a range of factors in relation to children with high needs with a specific focus on improving outcomes and managing the SEND system effectively.

Housing and Homelessness Module
Evaluates how effectively councils create housing stability and prevent homelessness, linking outcomes with spend to support prevention-focused, place-based decision-making.

NEW Local Government Outcomes Framework Module
We combine productivity data with the three year fair funding settlement to assess futures challenges for councils.

Waste and Recycling Module
Evaluates waste collection, recycling and behaviour change in reducing cost, carbon and environmental impact to create cleaner, more sustainable places.
Applied analytics practice
Our applied analytics team helps public sector leaders make better decisions using clear, practical evidence. We work alongside delivery teams to understand demand, capacity, cost and outcomes, translating complex data into insight that leaders can use with confidence.
Applied analytics practice
Our applied analytics team helps public sector leaders make better decisions using clear, practical evidence. We work alongside delivery teams to understand demand, capacity, cost and outcomes, translating complex data into insight that leaders can use with confidence.