
Blogs
Local government funding fault lines – uncovering the council neighbours with the biggest variances in funding.
Fair Funding map 2026
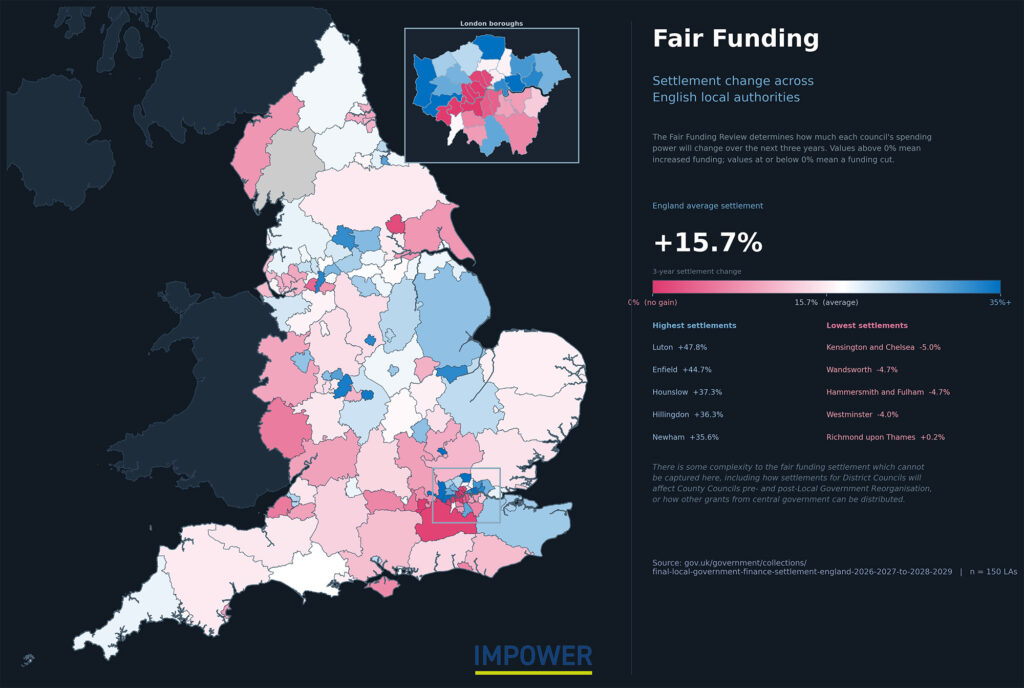
One of the biggest questions we’ve been asked following our publication of the top 10 productive councils, is how much will the changes in local government settlement change our ranking. It is a fascinating question.
This map shows, according to Government calculations, who the ‘winners’ and ‘losers’ are. (The darker red being the biggest ‘losers’ and the darkest blue being the biggest ‘winners’. Those in red are receiving lower increases over three years relative to the nationwide average, whereas those in blue are receiving greater increases).
One thing that jumps out from seeing the map is where the biggest funding fault lines are. It highlights council boundaries where over the next three years, there will be significant variation in funding either side. One side of some streets will see funding increase much slower than demand with the other side seeing up to 50% increase. Even outside of London where the stark variances have been much commented on, there are at least 15 council boundaries where ‘big losers’ are across the road from ‘big winners’.
It is really important to understand this map. Your neighbour’s financial position will have a direct and indirect impact on your own council. It may directly impact recruitment and retention, access and rates for care provision etc as well as indirectly impact the political and public narrative.
Of course, these government calculations may not be how funding actually is in reality or in perception locally. There will be reasons the government’s calculations don’t play out in reality – not least assumptions on council tax rates and collection. Perhaps more importantly is the perception. I’ve spoken to a number of Chief Executives where the local narrative is not the same as the facts – interestingly, it is equally a problem whether the incorrect perception is of being a winner or loser.
This means there is an opportunity now to influence the local narrative. To what extent do you have headroom to invest now to impact in three years? To what extent do you have an urgent need to look more creatively at ways to tackle demand?
If you would like to talk through your council’s productivity and funding compared to others, and what opportunities and challenges that leaves you, please get in touch: [email protected].
Please note: The map illustrates how much each council’s spending power will change over the next three years impacted by the fair funding review. Values above 0% indicate an increase and below 0% a decrease. The highest settlements are shown as blue and lowest as red. There is some complexity to the fair funding settlement which cannot be captured here, including how settlements for District Councils will affect County Councils pre-and post- local government reorganisation, or how other grants from central government can be distributed.